Before we go any further into mixing — before we talk about compression, mastering, or any of the tools that shape dynamics — we need to have an uncomfortable conversation. Your ears are lying to you.
Not a little. A lot. And if you don’t understand how they’re lying, every mixing decision you make will be built on a false foundation.
Your ears are lying to you. Not a little. A lot.
— Nathan Rosenberg, Beat KitchenYour Ears Are Not Flat
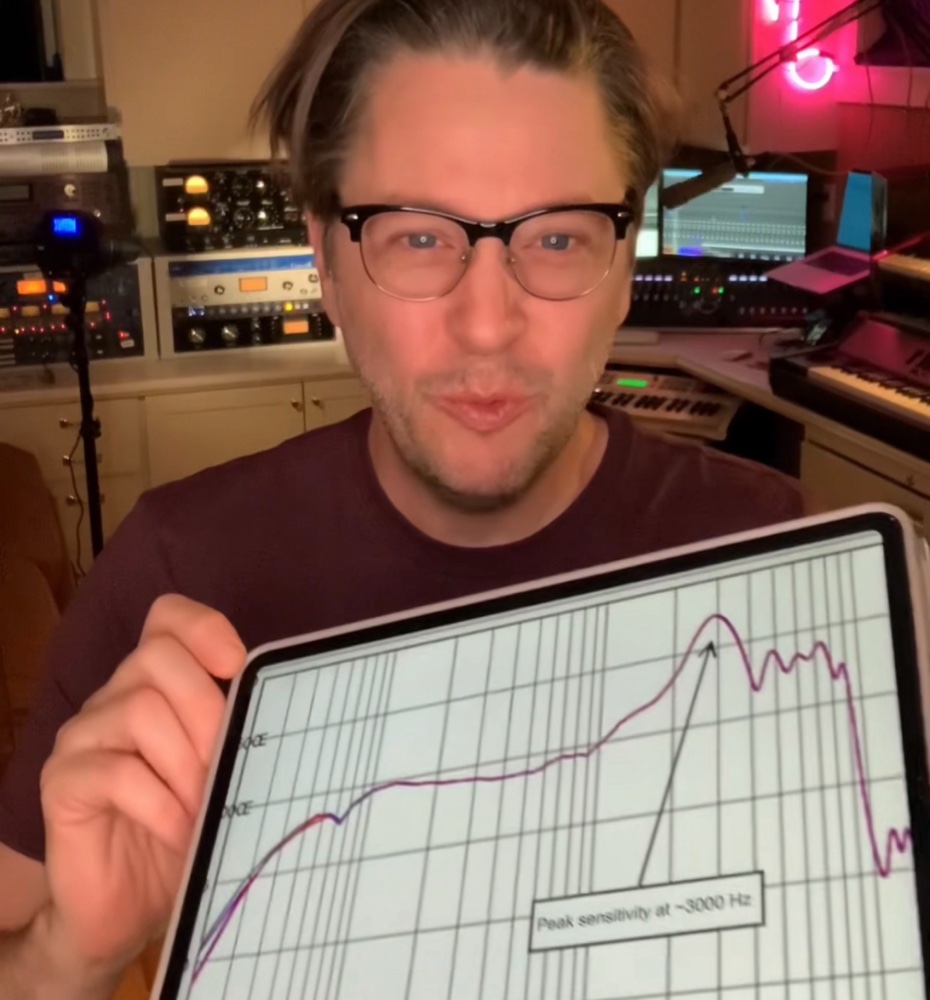
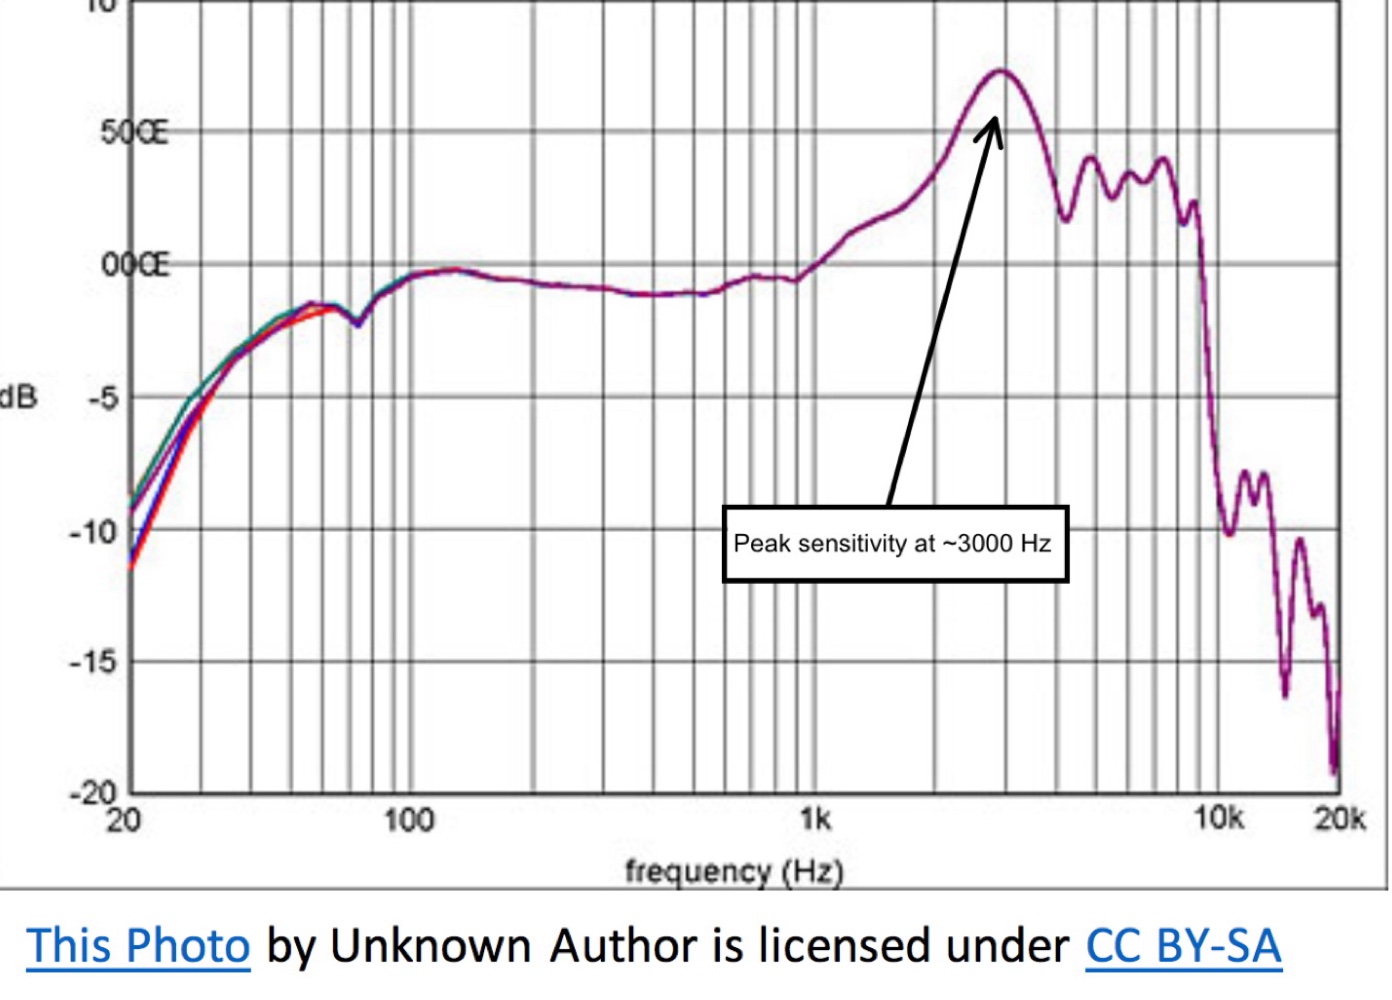
Equal loudness contours (Fletcher-Munson/ISO 226 curves) showing how human sensitivity varies across frequencies. Label the 2-5 kHz speech sensitivity peak and the reduced bass sensitivity.
That frequency response chart that came with your nice set of studio monitors? Maybe it looked something like a gently rolling line, close to flat across the audible range. That chart tells you that your speakers reproduce all frequencies at roughly equal volume. Great.
Now imagine your ears came with a frequency response chart. It would look like it was drawn by a random two-year-old.
Human hearing is profoundly uneven. We’re most sensitive to frequencies in the 2-5 kHz range — the range of human speech, particularly consonants. That makes evolutionary sense: hearing the difference between “snake” and “snack” could save your life. But it means you perceive those frequencies as louder than they actually are, relative to bass and extreme high end.
The bass frequencies? You need a lot more energy — a lot more actual sound pressure — to perceive them at the same loudness as the midrange. A 50 Hz tone has to be significantly louder in absolute terms to sound as loud as a 3 kHz tone.
Volume Changes What You Hear
Fletcher-Munson curves at different SPL levels: show how the curves flatten at higher volumes (bass and treble become more perceptible) and dip at lower volumes (bass drops away first).
It gets worse. Your ear’s uneven frequency response isn’t fixed. It changes depending on how loud the sound is.
At moderate listening levels, your ear is relatively more sensitive to the midrange and relatively less sensitive to bass and treble. Turn the volume up and the response flattens out — the bass seems to “appear,” the highs become more present, everything sounds fuller and more exciting. Turn it down and the bass drops away first, then the extreme highs — what’s left is mostly midrange.
Take a song with a prominent bass line and start turning it down. You’ll notice the bass goes away first. That’s not the speakers failing — it’s your ears deceiving you.
These patterns are documented in what are called equal loudness contours — curves that show how much sound pressure is needed at each frequency to be perceived as equally loud. The original research was done by Fletcher and Munson in the 1930s, and the curves have been refined since (the current standard is ISO 226). But the core finding hasn’t changed: your perception of frequency balance shifts with volume.
It makes a lot of sense that human beings would evolve to hear best around the frequencies we use to speak. It also makes sense that when you hear something low that’s loud enough, you might find it exciting. What doesn’t make sense is making critical mixing decisions based on a frequency response that changes depending on how loud your monitoring is.
Why This Matters for Mixing
This isn’t abstract science. It has direct, practical consequences:
Mix at a consistent monitoring level. If you keep turning the volume up to “check the bass,” you’re hearing a different frequency balance every time. Pick a level and stick with it for the bulk of your mixing work. Most engineers recommend a moderate level — loud enough to hear everything clearly, quiet enough that you can still hold a conversation.
Don’t chase the low end at low volumes. If you’re mixing quietly and the bass sounds thin, it’s probably your ears, not your mix. Turn it up to your reference level, check the bass, then turn it back down and keep working.
Reference your mix on different systems. The frequency-dependent loudness perception means your mix will sound different on every system at every volume. That’s unavoidable. But if it sounds good enough on multiple systems, you’re in the right neighborhood.
Be skeptical of “louder = better.” A compressor almost always makes things sound louder, and louder almost always sounds “better” in the moment. But that’s your ears’ frequency response flattening at higher levels, not the compressor actually improving the sound. Always level-match when comparing processed and unprocessed signals.
This is why it would be irresponsible to talk about dynamics processing until you understand this. A compressor takes that moving goalpost and moves it even more. If you don’t understand that your ears are already skewing the picture, compression will fool you every time.
If you’re thinking “wait — what’s the difference between what we just described and compression?” — you’re asking exactly the right question. Chapter 15.
SPL: Sound Pressure Level
SPL — sound pressure level — is the physical measurement of how loud a sound is, measured in decibels relative to the threshold of human hearing (0 dB SPL, roughly the quietest sound a healthy ear can detect).
- Normal conversation: ~60 dB SPL
- A mixing session at moderate volume: ~75-85 dB SPL
- A loud concert: ~100-110 dB SPL
- Threshold of pain: ~120-130 dB SPL
Hearing damage is cumulative and irreversible. Prolonged exposure above 85 dB SPL causes permanent hearing loss over time. A single exposure above 120 dB SPL can cause immediate damage. As someone who works with audio, your ears are your most important tool. Protect them. Take breaks. Turn it down.
If you can’t hear the detail in your mix at a moderate volume, the problem is the mix, not the monitoring level.
The Loudness War
Through the 1990s and 2000s, a competitive trend emerged: each new release was mastered louder than the last. The logic was simple — in a playlist or on the radio, the louder track sounds “better” (remember: louder triggers that flattened frequency response, which sounds more exciting).
The tool for making things louder was the limiter — a type of compressor that prevents the signal from exceeding a maximum level. By driving more and more signal into a limiter, engineers could increase the average loudness of a track without exceeding the peak level. The cost? Dynamic range — the difference between the loudest and quietest moments in the music. Heavy limiting squashes those differences, making everything equally loud. The music loses its ability to breathe, to build, to surprise.
The loudness war is largely over — not because people came to their senses, but because streaming platforms solved the problem. Spotify, Apple Music, YouTube, and others apply loudness normalization: they measure the integrated loudness of a track and turn it up or down so everything plays back at roughly the same perceived volume. A heavily limited, maximally loud master gets turned down by the platform, and now it sounds worse than a dynamic master — all the squashing, none of the benefit.
This means the “right” mastering strategy today is to aim for a specific loudness target and preserve as much dynamic range as possible. Which brings us to how we measure that.
LUFS: Measuring What Humans Hear
LUFS metering plugin screenshot showing integrated LUFS, short-term LUFS, momentary LUFS, and true peak. Annotate the streaming platform target range (-14 to -16 LUFS).
Loudness Units relative to Full Scale — a loudness measurement weighted to approximate human perception. Unlike peak or RMS meters, LUFS accounts for the ear's uneven sensitivity across frequencies. One LUFS is equivalent to one decibel: if you're at -14 and need -16, push the fader down 2 dB.
LUFS (Loudness Units relative to Full Scale) is a loudness measurement designed to approximate human perception. Unlike peak meters (which show the instantaneous maximum level) or RMS meters (which show the average energy), LUFS meters apply a frequency weighting that accounts for the ear’s uneven sensitivity — they weight midrange frequencies more heavily, matching how you actually perceive loudness.
The targets that matter:
| Platform | Target (Integrated LUFS) |
|---|---|
| Spotify | -14 LUFS |
| Apple Music | -16 LUFS |
| YouTube | -14 LUFS |
| Broadcast (EBU R128) | -23 LUFS |
These aren’t hard limits — they’re normalization targets. If your master is louder than the target, the platform turns it down. If it’s quieter, some platforms turn it up. The goal is to master at or near the target so the platform doesn’t have to adjust your work.
Most modern DAWs include a LUFS meter, or you can use a dedicated metering plugin. Get in the habit of checking your integrated LUFS before you call a mix finished. It won’t tell you if the mix is good, but it’ll tell you if the level is in the right ballpark.
What to Practice
- Do the listening test: play a song you know well and gradually turn the volume down. Notice which frequencies disappear first (bass, then highs). Then turn it back up and notice how the bass and treble “return.” That’s Fletcher-Munson in real time.
- Check your typical mixing volume with an SPL meter (most smartphones have a free app that’s accurate enough). Are you in the 75-85 dB range? If you’re regularly above 90 dB, you’re both damaging your hearing and distorting your perception of the mix.
- If you have a LUFS meter, measure a few of your favorite commercially released tracks. Notice how they cluster around the platform targets. Then measure your own work and compare.
Search This Guide
This Course
- 1. Sound, Vibration, and the Harmonic Series
- 2. Filtering Sound — From Harmonics to EQ
- 3. Oscillators and Waveforms
- 4. Shaping Sound — Envelopes, Filters, and Amplifiers
- 5. Modulation and Movement — LFO, Unison, and Glide
- 6. Sound Design and Comparing Synths
- 7. Signal Chain and Gain Staging
- 8. Human Hearing and Loudness Perception
- 9. Introduction to Mastering — Perfect, Pretty, Loud
- 10. Reference Tracks — The Most Important Tool in Mixing
- 11. Signal Flow and Mixer Routing
- 12. Session Setup and Organization
- 13. The Art and Science of Mixing
- 14. Mixing in Practice — The Reference Method
- 15. Introduction to Dynamics — Gates and Expansion
- 16. Compression I — The Basics
- 17. Compression II — Shaping
- 18. Mastering Revisited — Dynamics in Context
- 19. Compression III — Types, Parallel, and Advanced
- 20. Multiband, De-Esser, Dynamic EQ, and Sidechain
- 21. Delay — Time, Rhythm, and the Haas Effect
- 22. Introduction to Stereo
- 23. Mid-Side and Stereo Recording
- 24. Acoustics and Room Treatment
- 25. Reverb — Space, Types, and Practice
- 26. Modulation and Creative Effects
- 27. Sources and Further Reading
Related Videos
When you're ready to take the next step, it starts with a place where you can ask questions. We teach live — small group, cameras optional, taught by someone who gives a shit.
Find Out How You Can Join Us →© 2026 Beat Kitchen School — beatkitchen.io. Licensed under CC BY-NC-SA 4.0. Free to share and adapt for non-commercial purposes with attribution.